An interactive Tableau dashboard to monitor client KPIs, analyze performance trends, and reveal insights that drive smarter business decisions.
Overview
Problem Statement
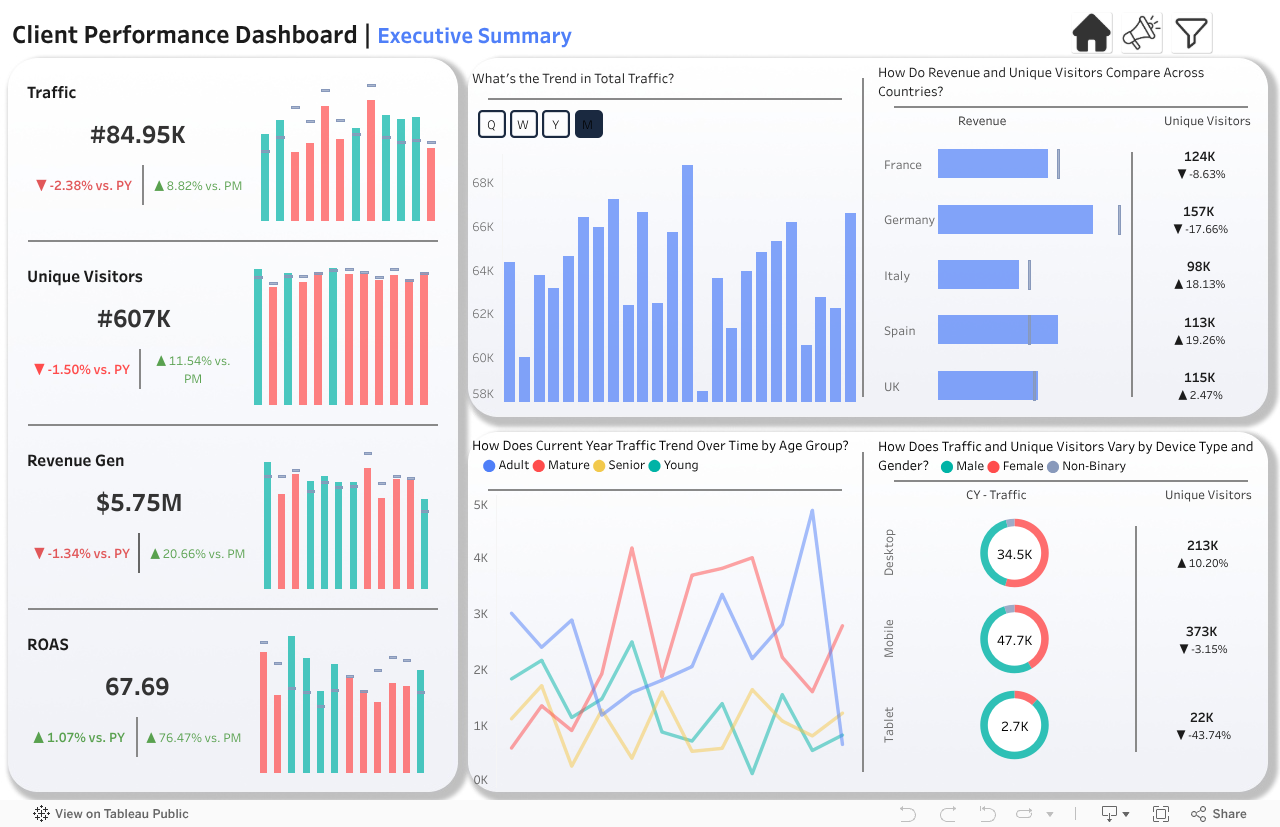
Many businesses struggle with limited visibility into client behavior, performance trends, and market differences. Without clear, consolidated insights, it’s challenging to track key KPIs, identify growth opportunities, and make data-driven decisions that improve efficiency and results. My dashboard includes critical metrics like total traffic, unique visitors, revenue generated, ROAS, and rate of ad spend, helping answer questions about traffic trends, year-over-year changes by age group, and comparisons of revenue and visitors across countries.
Industry
Client Insights & Performance — Ideal for analysts, business managers, and decision-makers focused on growth and efficiency.
Objectives
Track key client KPIs like traffic, revenue, and ROAS
Analyze performance trends over time and by demographics
Compare client metrics across regions and countries
Identify insights to improve client strategies and business outcomes
Solution
Built a dual-tab Tableau dashboard with an Executive Summary and Campaign Performance view. Combined key client KPIs like Bounce Rate and Conversion Rate. Focused on clarity, performance insights, and data-driven decisions.