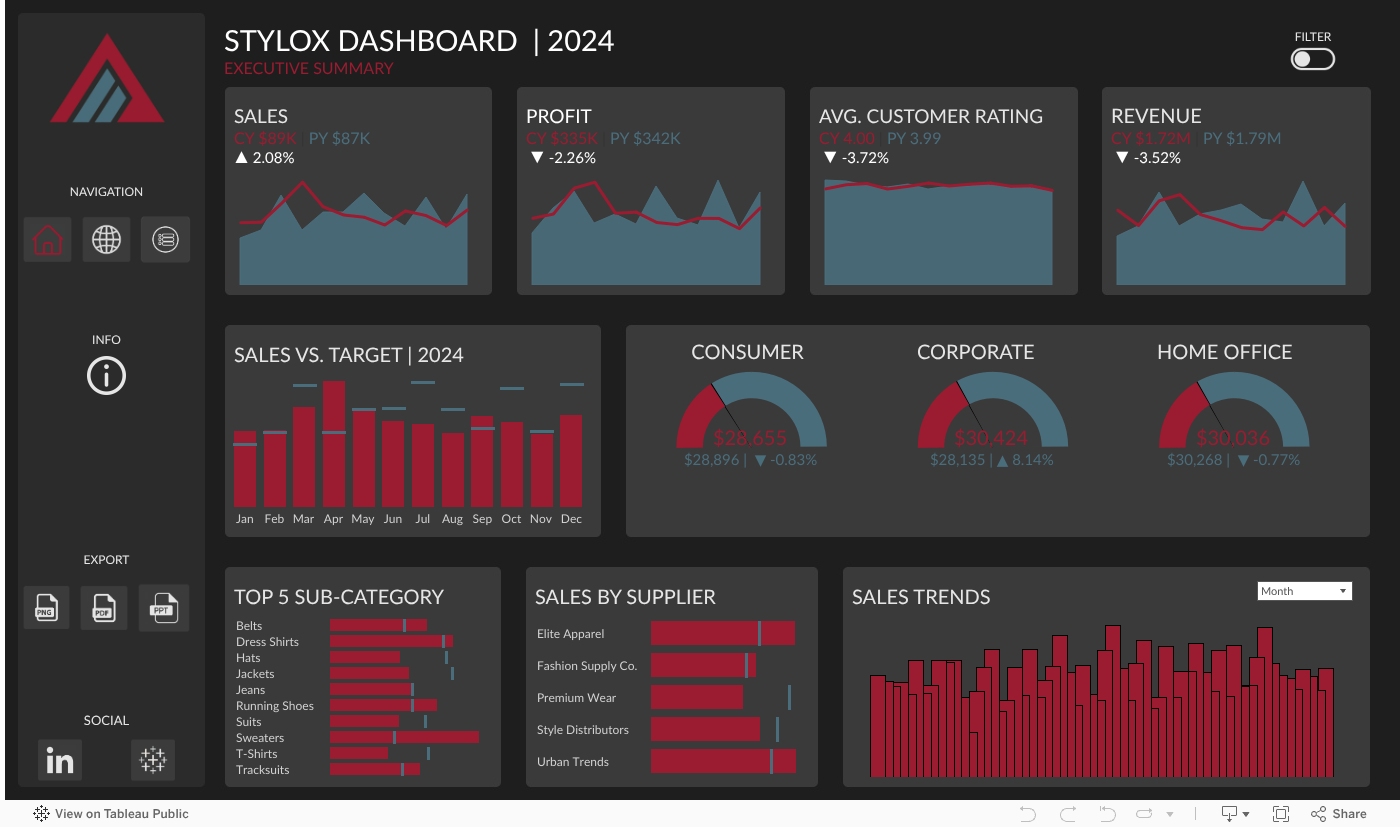
An interactive view of sales trends, customer ratings, and product performance for strategic retail decisions.
Overview
Problem Statement
E-commerce businesses often struggle to monitor key performance indicators across regions and product categories. Manual reporting and siloed data lead to missed sales opportunities and unclear trends.
Industry
Retail & E-commerce — Targeted at operations teams, sales executives, and business analysts who need fast access to sales performance data.
Objectives
Track year-over-year sales and profit trends.
Monitor revenue and customer satisfaction (avg. rating).
Visualize performance vs. target.
Enable drill-down into states and individual orders.
Solution
Developed three interactive Tableau dashboards:
Executive Summary (Home)
Regional & State Performance
Order-level Details
Designed for clarity, interactivity, and smooth navigation between dashboards, focusing on usability for business decision-makers.
Key Features
Year-over-Year change visualizations.
Sales vs. Target tracking.
Top 5 Sub-Category insights.
Filters for region, category, and state.
Drill-down navigation across dashboards.
Optimized for desktop viewing and smooth performance.
Result / Outcome
Unified performance tracking across the organization.
Reduced analysis time with real-time visuals.
Empowered stakeholders to spot trends and act faster.
Demonstrated best practices in dashboard UX/UI.
Tools Used
Tableau Public – Dashboard development
Retail Sample Dataset – Data source
HTML/CSS – Web embedding & layout styling
Figma – Used for designing the dashboard’s background image